Cumberland University Rankings
| Ranking | Category |
|---|---|
| #5818 of 14,131 | In the World |
| #1608 of 2,597 | In North America |
| #1522 of 2,496 | In the United States |
| #35 of 56 | In Tennessee |
| #6048 of 6,639 | For Sociology |
| #6179 of 6,670 | For Law |
| #6296 of 6,742 | For Political Science |
| #6535 of 7,088 | For Liberal Arts & Social Sciences |
Quick Review
- Acceptance rate
- 67%
- Undergraduates
- 2,745
- Graduates
- 712
- Male:Female Ratio
- 47:53
- Control
- Private
not-for-profit - Highest Degree
- Master's degree
- Website
- www.cumberland.edu
Cumberland University Acceptance rate and admissions statistics
Cumberland University has an acceptance rate of 67% and is among the top 29% of the most difficult universities to gain admission to in the United States. The university reports the admission statistics without distinguishing between local and international students.
| Total | Men | Women | |
|---|---|---|---|
| Acceptance Rate | 67% | 69% | 66% |
| Applicants | 2,495 | 1,065 | 1,430 |
| Admissions | 1,680 | 734 | 946 |
| Freshmen enrolled full time | 675 | 311 | 364 |
| Freshmen enrolled part time | 6 | 1 | 5 |
1,350 students enrolled in some distance education courses.
400 enrolled exclusively in distance education.
Admissions requirements
| Secondary school GPA | Required |
|---|---|
| Secondary school record | Required |
| TOEFL | Required |
| College-preparatory program | Considered but not required |
| Formal demonstration of competencies | Considered but not required |
| Recommendations | Considered but not required |
| Secondary school rank | Considered but not required |
| Other Tests | Neither required nor recommended |
| SAT/ACT | Neither required nor recommended |
Enrollment demographics by race or ethnicity
| White | 1896 (55%) |
|---|---|
| Nonresident Alien | 591 (17%) |
| Black or African American | 344 (10%) |
| Hispanic | 277 (8%) |
| Race or Ethnicity unknown | 158 (5%) |
| Two or more races | 121 (4%) |
| Asian | 52 (2%) |
| Native Hawaiian or other Pacific Islander | 6 (0.2%) |
| American Indian or Alaska Native | 6 (0.2%) |
Costs per year: Tuition, Housing, Fees
The average net cost to attend Cumberland University is $18,499 per year, calculated as the sum of the average cost of tuition, room and board, books, and supplies, reduced by the amount of average financial aid received.
The final cost of attendance varies for each student based on household income, residency, program, and other factors.
Average costs by household income
| <$30K | $17,882 |
|---|---|
| $30-48K | $18,048 |
| $48-75K | $19,609 |
| $75-110K | $20,333 |
| $110K+ | $20,917 |
Tuition and fees
| Undergraduates | Graduates | |
|---|---|---|
| Tuition in-district | $26,640 | $8,280 |
| Tuition in-state | $26,640 | $8,280 |
| Tuition out-of-state | $26,640 | $8,280 |
| Fee in-district | $1,200 | |
| Fee in-state | $1,200 | |
| Fee out-of-state | $1,200 |
Room and board costs
| Dormitory capacity | 647 |
|---|---|
| Combined charge for room and board | $9,000 |
| Room charge | $6,860 |
| Meal charge | $5,940 |
Cumberland University majors
Cumberland University has granted 293 bachelor's degrees across 27 programs and 131 master's across 12 programs. Below is a table with majors that lead to degrees at Cumberland University.
| Major | Associate | Bachelor | Master |
|---|---|---|---|
| Liberal Arts and Sciences, General Studies and Humanities, Other | 145 | ||
| Business Administration and Management, General | 54 | 43 | |
| Registered Nursing & Registered Nurse | 65 | ||
| Business Administration, Management and Operations, Other | 49 | ||
| Public Administration | 27 | ||
| Psychology, General | 26 | ||
| Exercise Science and Kinesiology | 17 | 5 | |
| Criminal Justice & Law Enforcement Administration | 20 | ||
| Education, General | 13 | 7 | |
| Teacher Education and Professional Development, Specific Subject Areas, Other | 18 | ||
| Accounting | 15 | ||
| Sports Studies | 13 | ||
| Biological and Biomedical Sciences, Other | 12 | ||
| Sport and Fitness Administration & Management | 11 | ||
| Fine & Studio Arts, General | 10 | ||
| Marketing & Marketing Management, General | 10 | ||
| English Language and Literature, General | 9 | ||
| General Studies | 9 | ||
| Corrections and Criminal Justice, Other | 8 | ||
| Management Science | 8 | ||
| Biomedical Sciences, General | 6 | ||
| Elementary Education and Teaching | 6 | ||
| History, General | 2 | 4 | |
| Health & Health Care Administration & Management | 5 | ||
| Mathematics, General | 5 | ||
| Information Technology | 4 | ||
| Nursing Education | 4 | ||
| Project Management | 4 | ||
| Athletic Training & Trainer | 3 | ||
| Creative Writing | 3 | ||
| Music, General | 2 | 1 | |
| Biochemistry | 2 | ||
| Chemistry, General | 2 | ||
| Educational Leadership and Administration, General | 2 | ||
| Information Technology Project Management | 2 | ||
| Liberal Arts and Sciences & Liberal Studies | 2 | ||
| Physical Education Teaching and Coaching | 2 | ||
| Special Education and Teaching, General | 2 | ||
| Biology & Biological Sciences, General | 1 | ||
| Reading Teacher Education | 1 | ||
| Social Sciences, General | 1 | ||
| Grand Total | 236 | 293 | 131 |
Cumberland University has a graduation rate of 46%, which is among the 34% lowest for universities in the US.
| Total | Men | Women | |
|---|---|---|---|
| Graduation rate | 46% | 39% | 51% |
| |||
Publications & Citations
Cumberland University has published 147 scientific papers with 1,241 citations received. The research profile covers a range of fields, including Liberal Arts & Social Sciences, Political Science, Law, Medicine, Sociology, Biology, Psychology, Computer Science, Environmental Science, and Physics.
Publication / Citation count by topic
Annual publication & citation counts
| Year | Publications | Citations |
|---|---|---|
| 1993 | 1 | 0 |
| 1994 | 0 | 2 |
| 1995 | 0 | 1 |
| 1996 | 0 | 4 |
| 1997 | 1 | 0 |
| 1998 | 4 | 1 |
| 1999 | 1 | 6 |
| 2000 | 3 | 7 |
| 2001 | 6 | 8 |
| 2002 | 3 | 10 |
| 2003 | 3 | 5 |
| 2004 | 3 | 9 |
| 2005 | 3 | 11 |
| 2006 | 0 | 15 |
| 2007 | 3 | 18 |
| 2008 | 2 | 15 |
| 2009 | 2 | 37 |
| 2010 | 6 | 25 |
| 2011 | 2 | 24 |
| 2012 | 2 | 49 |
| 2013 | 7 | 48 |
| 2014 | 7 | 63 |
| 2015 | 9 | 64 |
| 2016 | 5 | 58 |
| 2017 | 7 | 70 |
| 2018 | 7 | 62 |
| 2019 | 6 | 84 |
| 2020 | 9 | 82 |
| 2021 | 7 | 88 |
| 2022 | 6 | 84 |
| 2023 | 6 | 78 |
| 2024 | 5 | 93 |
| 2025 | 7 | 77 |
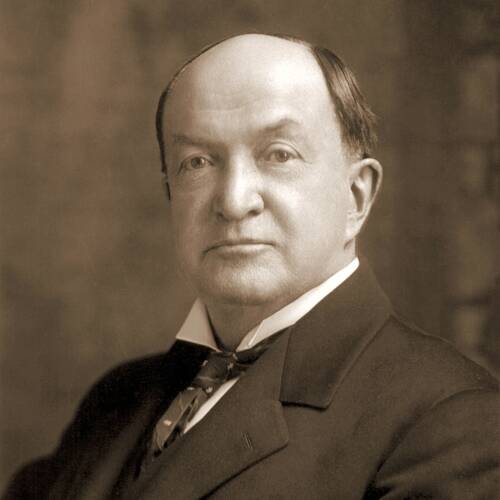
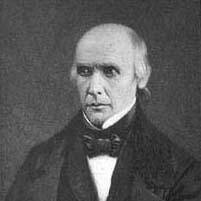
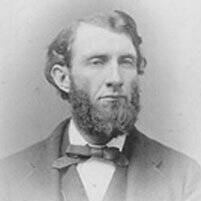
Cumberland University alumni
-
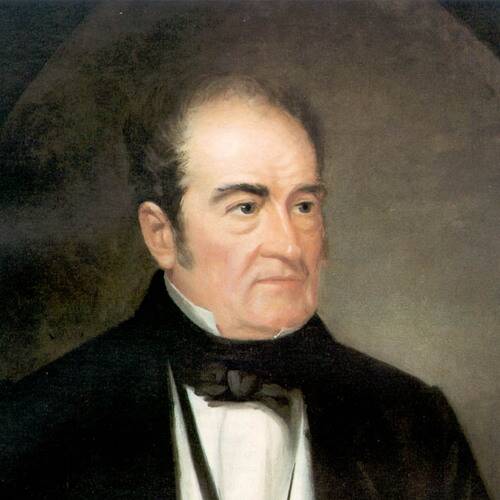
John Bell
- Occupations
- lawyerpolitician
- Biography
-
John Bell was an American politician, attorney, and planter who was a candidate for President of the United States in the election of 1860.
-
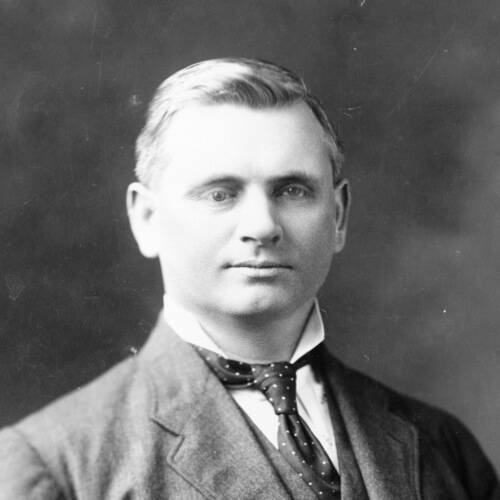
Thomas Gore
- Occupations
- peace activistlawyerpolitician
- Biography
-
Thomas Pryor Gore was an American politician who served as one of the first two United States senators from Oklahoma, from 1907 to 1921 and again from 1931 to 1937. He first entered politics as an activist for the Populist Party, and continued this affiliation after he moved to Texas. In 1899, just before moving to Oklahoma Territory to practice law in Lawton, he formally joined the Democratic Party and campaigned for William Jennings Bryan. In the Senate, his anti-war beliefs caused him conflict with Democratic presidents Woodrow Wilson and Franklin D. Roosevelt.
-
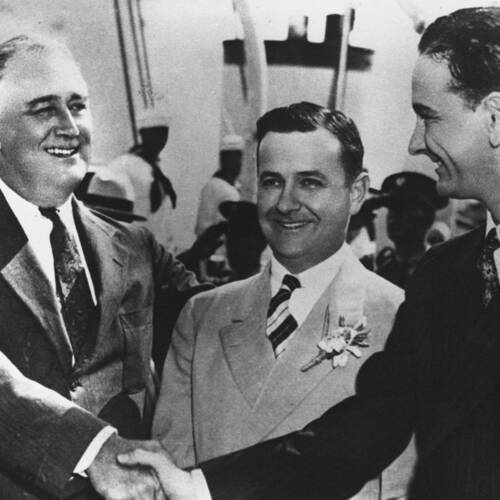
James Allred
- Occupations
- lawyerjudgepolitician
- Biography
-
James Burr V. Allred was the 33rd governor of Texas. He later served, twice, as a United States district judge of the United States District Court for the Southern District of Texas.
-
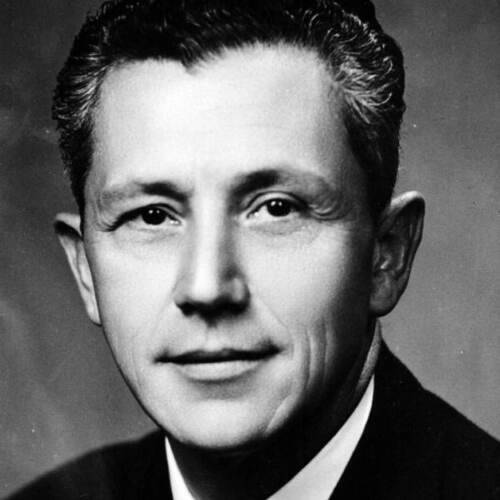
LeRoy Collins
- Occupations
- military officerlawyerpolitician
- Biography
-
Thomas LeRoy Collins was an American politician who served as the 33rd governor of Florida from 1955 to 1961. Collins began his governorship after winning a special election in 1954, and was elected to a four-year term in 1956.


General info
| Alternative names | CU |
|---|---|
| Founded | 1842 |
| Colors | maroon, white, gray, black |
| Academic calendar | August to May (August - December; January-May) |
| Total FTE staff | 364 |
| Carnegie classification | Master's Colleges & Universities: Medium Programs |
Location and contacts
| Address | 1 Cumberland Square Lebanon, Tennessee, 37087 United States |
|---|---|
| City population | 38,000 |
| Phone | 61544425621222 |