Franklin College: Statistics
Updated:
| Position | Category |
|---|---|
| #4821 of 14,131 | In the World |
| #1346 of 2,597 | In North America |
| #1268 of 2,496 | In the United States |
| #28 of 55 | In Indiana |
| #3396 of 3,582 | For Virology |
Quick Review
- Religion
- American Baptist
- Acceptance rate
- 70%
- Undergraduates
- 931
- Graduates
- 54
- Male:Female Ratio
- 49:51
- Control
- Private
not-for-profit - Highest Degree
- Master's degree
- Website
- franklincollege.edu
Franklin College Acceptance rate and admissions statistics
Franklin College has an acceptance rate of 70% and is among the top 32% of the most difficult universities to gain admission to in the United States. The university reports the admission statistics without distinguishing between local and international students.
| Total | Men | Women | |
|---|---|---|---|
| Acceptance Rate | 70% | 65% | 74% |
| Applicants | 2,609 | 1,222 | 1,360 |
| Admissions | 1,821 | 798 | 1,007 |
| Freshmen enrolled full time | 316 | 146 | 170 |
SAT scores
Among admitted applicants
124 or 39%
submitted SAT
25% of them
had 1060
or below
75% of them
had 1240
or below
Typical SAT scores of first-years in Franklin College are 1060-1240 (middle 50% range).
ACT scores
Among admitted applicants
14 or 4%
submitted ACT
25% of them
had 20
or below
75% of them
had 26
or below
Typical ACT scores of first-years in Franklin College are 20-26 (middle 50% range).
Admissions requirements
| Secondary school GPA | Required |
|---|---|
| Secondary school record | Required |
| TOEFL | Required |
| College-preparatory program | Considered but not required |
| Formal demonstration of competencies | Considered but not required |
| Recommendations | Considered but not required |
| SAT/ACT | Considered but not required |
| Secondary school rank | Considered but not required |
| Other Tests | Neither required nor recommended |
Enrollment demographics by race or ethnicity
| White | 762 (77%) |
|---|---|
| Black or African American | 57 (6%) |
| Hispanic | 50 (5%) |
| Nonresident Alien | 43 (4%) |
| Two or more races | 41 (4%) |
| Asian | 16 (2%) |
| Race or Ethnicity unknown | 13 (1%) |
| Native Hawaiian or other Pacific Islander | 1 (0.1%) |
| American Indian or Alaska Native | 1 (0.1%) |
Costs per year: Tuition, Housing, Fees
The average net cost to attend Franklin College is $24,189 per year, calculated as the sum of the average cost of tuition, room and board, books, and supplies, reduced by the amount of average financial aid received.
The final cost of attendance varies for each student based on household income, residency, program, and other factors.
Average costs by household income
| <$30K | $14,790 |
|---|---|
| $30-48K | $15,822 |
| $48-75K | $20,093 |
| $75-110K | $23,439 |
| $110K+ | $30,316 |
Tuition and fees
| Undergraduates | Graduates | |
|---|---|---|
| Tuition in-district | $37,810 | $39,114 |
| Tuition in-state | $37,810 | $39,114 |
| Tuition out-of-state | $37,810 | $39,114 |
| Fee in-district | $900 | $900 |
| Fee in-state | $900 | $900 |
| Fee out-of-state | $900 | $900 |
Room and board costs
| Dormitory capacity | 689 |
|---|---|
| Combined charge for room and board | $12,405 |
| Room charge | $6,800 |
| Meal charge | $5,605 |
Franklin College majors
Franklin College has granted 191 bachelor's degrees across 32 programs and 27 master's across 2 programs. Below is a table with majors that lead to degrees at Franklin College.
| Major | Bachelor | Master |
|---|---|---|
| Physician Assistant | 22 | |
| Exercise Science and Kinesiology | 20 | |
| Psychology, General | 19 | |
| Business Administration and Management, General | 18 | |
| Elementary Education and Teaching | 14 | |
| Sports Communication | 11 | |
| Public Relations, Advertising, and Applied Communication | 10 | |
| Biology & Biological Sciences, General | 8 | |
| Business & Commerce, General | 8 | |
| Computer Science | 8 | |
| Accounting | 7 | |
| Biomedical Sciences, General | 7 | |
| History, General | 7 | |
| Sociology, General | 7 | |
| Applied Mathematics, General | 5 | |
| Athletic Training & Trainer | 5 | |
| Chemistry, General | 5 | |
| Creative Writing | 4 | |
| Finance, General | 4 | |
| Drama and Dramatics & Theatre Arts, General | 3 | |
| English Language and Literature, General | 3 | |
| Graphic Design | 3 | |
| Journalism | 3 | |
| Political Science and Government, General | 3 | |
| Art History, Criticism and Conservation | 2 | |
| Data Science, General | 2 | |
| Ecology | 2 | |
| Music, General | 2 | |
| Biophysics | 1 | |
| Economics, General | 1 | |
| Fine & Studio Arts, General | 1 | |
| Neuroscience | 1 | |
| Painting | 1 | |
| Photography | 1 | |
| Grand Total | 191 | 27 |
Franklin College has a graduation rate of 60%, which is among the 39% highest for universities in the US.
| Total | Men | Women | |
|---|---|---|---|
| Graduation rate | 60% | 57% | 63% |
| |||
Publications & Citations
Franklin College has published 728 scientific papers with 11,962 citations received. The research profile covers a range of fields, including Biology, Medicine, Liberal Arts & Social Sciences, Computer Science, Chemistry, Environmental Science, Genetics, Engineering, Biochemistry, and Psychology.
Publication / Citation count by topic
Annual publication & citation counts
| Year | Publications | Citations |
|---|---|---|
| 1993 | 19 | 53 |
| 1994 | 1 | 74 |
| 1995 | 3 | 56 |
| 1996 | 2 | 60 |
| 1997 | 2 | 56 |
| 1998 | 14 | 56 |
| 1999 | 6 | 67 |
| 2000 | 9 | 108 |
| 2001 | 6 | 66 |
| 2002 | 10 | 93 |
| 2003 | 4 | 91 |
| 2004 | 11 | 110 |
| 2005 | 9 | 106 |
| 2006 | 11 | 162 |
| 2007 | 4 | 122 |
| 2008 | 4 | 165 |
| 2009 | 6 | 152 |
| 2010 | 6 | 166 |
| 2011 | 9 | 143 |
| 2012 | 16 | 197 |
| 2013 | 17 | 225 |
| 2014 | 9 | 230 |
| 2015 | 20 | 197 |
| 2016 | 17 | 274 |
| 2017 | 13 | 286 |
| 2018 | 27 | 353 |
| 2019 | 37 | 470 |
| 2020 | 83 | 740 |
| 2021 | 71 | 1071 |
| 2022 | 49 | 1187 |
| 2023 | 70 | 1400 |
| 2024 | 52 | 1694 |
| 2025 | 53 | 1712 |
Franklin College alumni
-
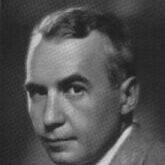
Robert Wise

- Occupations
- directorfilm directortrade unionistfilm editorfilm producer
- Biography
-
Robert Earl Wise was an American filmmaker. He won the Academy Awards for Best Director and Best Picture for his musical films West Side Story (1961) and The Sound of Music (1965). He was also nominated for Best Film Editing for Citizen Kane (1941) and directed and produced The Sand Pebbles (1966), which was nominated for Best Picture.
-
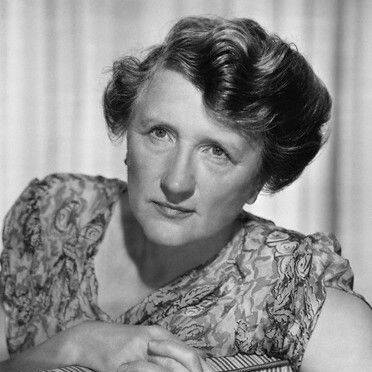
Marjorie Main
- Occupations
- stage actortelevision actorcharacter actoractorfilm actor
- Biography
-
Mary Tomlinson, professionally known as Marjorie Main, was an American character actress and singer of the Classical Hollywood period, best known as a Metro-Goldwyn-Mayer contract player in the 1940s and 1950s, and for her role as Ma Kettle in 10 Ma and Pa Kettle movies. Main started her career in vaudeville and theatre, and appeared in film classics, such as Dead End (1937), The Women (1939), Dark Command (1940), The Shepherd of the Hills (1941), Meet Me in St. Louis (1944), and Friendly Persuasion (1956). Main, best known for playing "raucous, rough, and cantankerous women" on-screen, was characterized as "soft-spoken, shy," and "dignified" off-screen.
-
Edna Parker

- Occupations
- teacher
- Biography
-
Edna Ruth Parker was an American supercentenarian who, for 15 months, was recognized as the oldest person in the world. She was featured in two documentaries and included in a Boston University DNA database of supercentenarians.
-
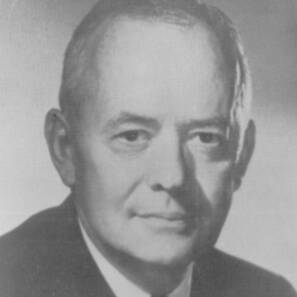
Elmer Davis
- Occupations
- writer
- Biography
-
Elmer Holmes Davis was an American news reporter, author, the Director of the United States Office of War Information during World War II and a Peabody Award recipient.


General info
| Alternative names | Franklin College of Indiana FC |
|---|---|
| Founded | 1834 |
| Motto | Excellence, Leadership and Service |
| Colors | navy blue, old gold |
| Total FTE staff | 250 |
| Carnegie classification | Baccalaureate Colleges: Arts & Sciences Focus |
Location and contacts
| Address | 101 Branigin Blvd Franklin, Indiana, 46131-2623 United States |
|---|---|
| City population | 25,000 |
| Phone | 3177388000 |