Baker College: Statistics
Updated:
| Position | Category |
|---|---|
| #4965 of 14,131 | In the World |
| #1393 of 2,597 | In North America |
| #1315 of 2,496 | In the United States |
| #33 of 62 | In Michigan |
| #2 of 3 | In Flint |
| #5350 of 6,742 | For Political Science |
Quick Review
- Acceptance rate
- 82%
- Undergraduates
- 3,595
- Graduates
- 360
- Male:Female Ratio
- 24:76
- Control
- Private
not-for-profit - Highest Degree
- Doctor's degree
- Website
- www.baker.edu
Baker College Acceptance rate and admissions statistics
Baker College has an acceptance rate of 82% and is in the middle in terms of the difficulty of admission among universities in the United States. The university reports the admission statistics without distinguishing between local and international students.
| Total | Men | Women | |
|---|---|---|---|
| Acceptance Rate | 82% | 79% | 83% |
| Applicants | 1,153 | 262 | 869 |
| Admissions | 944 | 207 | 720 |
| Freshmen enrolled full time | 281 | 65 | 216 |
| Freshmen enrolled part time | 130 | 24 | 101 |
338 students enrolled in some distance education courses.
2,474 enrolled exclusively in distance education.
SAT scores
Among admitted applicants
37 or 9%
submitted SAT
25% of them
had 960
or below
75% of them
had 1160
or below
Typical SAT scores of first-years in Baker College are 960-1160 (middle 50% range).
ACT scores
Among admitted applicants
1 or 0%
submitted ACT
Admissions requirements
| Secondary school GPA | Required |
|---|---|
| Secondary school record | Required |
| TOEFL | Required |
| College-preparatory program | Considered but not required |
| SAT/ACT | Considered but not required |
| Formal demonstration of competencies | Neither required nor recommended |
| Other Tests | Neither required nor recommended |
| Recommendations | Neither required nor recommended |
| Secondary school rank | Neither required nor recommended |
Enrollment demographics by race or ethnicity
| White | 2850 (72%) |
|---|---|
| Black or African American | 438 (11%) |
| Hispanic | 241 (6%) |
| Race or Ethnicity unknown | 168 (4%) |
| Two or more races | 126 (3%) |
| Asian | 89 (2%) |
| Nonresident Alien | 12 (0.3%) |
| American Indian or Alaska Native | 6 (0.2%) |
| Native Hawaiian or other Pacific Islander | 5 (0.1%) |
Costs per year: Tuition, Housing, Fees
The average net cost to attend Baker College is $13,616 per year, calculated as the sum of the average cost of tuition, room and board, books, and supplies, reduced by the amount of average financial aid received.
The final cost of attendance varies for each student based on household income, residency, program, and other factors.
Average costs by household income
| <$30K | $11,976 |
|---|---|
| $30-48K | $11,362 |
| $48-75K | $12,546 |
| $75-110K | $13,754 |
| $110K+ | $17,964 |
Tuition and fees
| Undergraduates | Graduates | |
|---|---|---|
| Tuition in-district | $12,600 | $10,800 |
| Tuition in-state | $12,600 | $10,800 |
| Tuition out-of-state | $12,600 | $10,800 |
| Fee in-district | $400 | $450 |
| Fee in-state | $400 | $450 |
| Fee out-of-state | $400 | $450 |
Room and board costs
| Dormitory capacity | 558 |
|---|---|
| Room charge | $4,600 |
Baker College majors
Baker College has granted 576 bachelor's degrees across 17 programs, 88 master's across 8 programs, and 15 doctorate degrees across 2 programs. Below is a table with majors that lead to degrees at Baker College.
| Major | Associate | Bachelor | Master | Doctoral |
|---|---|---|---|---|
| Registered Nursing & Registered Nurse | 170 | |||
| Business Administration and Management, General | 115 | 23 | 1 | |
| General Studies | 49 | 28 | ||
| Veterinary & Animal Health Technology & Technician and Veterinary Assistant | 58 | |||
| Health & Health Care Administration & Management | 46 | 9 | ||
| Psychology, General | 37 | |||
| Medical Radiologic Technology & Science - Radiation Therapist | 33 | |||
| Human Resources Management & Personnel Administration, General | 19 | 13 | ||
| Accounting | 23 | 8 | ||
| Physical Therapy Assistant | 30 | |||
| Child Development | 12 | 12 | ||
| Baking and Pastry Arts & Baker & Pastry Chef | 23 | |||
| Computer Science | 23 | |||
| Family and Community Services | 23 | |||
| Computer and Information Systems Security & Auditing & Information Assurance | 22 | |||
| Culinary Arts & Chef Training | 19 | |||
| Corrections | 4 | 13 | ||
| Computer Game Programming | 16 | |||
| Diagnostic Medical Sonography & Sonographer and Ultrasound Technician | 15 | |||
| Law | 14 | |||
| Surgical Technology & Technologist | 13 | |||
| Electrocardiograph Technology & Technician | 12 | |||
| Health Information & Medical Records Technology & Technician | 11 | |||
| Occupational Therapy & Therapist | 11 | |||
| Computer Programming & Programmer, General | 10 | |||
| Industrial and Organizational Psychology | 9 | |||
| Management Information Systems, General | 9 | |||
| Marketing & Marketing Management, General | 9 | |||
| Logistics, Materials, and Supply Chain Management | 7 | |||
| Medium & Heavy Vehicle and Truck Technology & Technician | 6 | |||
| Nursing Education | 6 | |||
| Restaurant, Culinary, and Catering Management & Manager | 6 | |||
| Occupational Therapist Assistant | 5 | |||
| Finance, General | 3 | |||
| Mechatronics, Robotics, and Automation Engineering Technology & Technician | 3 | |||
| Automobile & Automotive Mechanics Technology & Technician | 2 | |||
| Grand Total | 301 | 576 | 88 | 15 |
Baker College has a graduation rate of 36%, which is among the 19% lowest for universities in the US.
| Total | Men | Women | |
|---|---|---|---|
| Graduation rate | 36% | 34% | 37% |
| |||
Publications & Citations
Baker College has published 196 scientific papers with 1,733 citations received. The research profile covers a range of fields, including Liberal Arts & Social Sciences, Political Science, Law, Computer Science, Engineering, Psychology, Philosophy, Medicine, Biology, and Sociology.
Publication / Citation count by topic
Annual publication & citation counts
| Year | Publications | Citations |
|---|---|---|
| 1993 | 1 | 4 |
| 1994 | 5 | 5 |
| 1995 | 3 | 3 |
| 1996 | 2 | 1 |
| 1997 | 4 | 3 |
| 1998 | 3 | 1 |
| 1999 | 11 | 2 |
| 2000 | 3 | 12 |
| 2001 | 1 | 20 |
| 2002 | 3 | 20 |
| 2003 | 3 | 21 |
| 2004 | 2 | 15 |
| 2005 | 3 | 21 |
| 2006 | 3 | 27 |
| 2007 | 4 | 10 |
| 2008 | 10 | 12 |
| 2009 | 14 | 34 |
| 2010 | 10 | 49 |
| 2011 | 10 | 59 |
| 2012 | 9 | 62 |
| 2013 | 9 | 67 |
| 2014 | 9 | 67 |
| 2015 | 4 | 82 |
| 2016 | 9 | 68 |
| 2017 | 4 | 69 |
| 2018 | 5 | 62 |
| 2019 | 2 | 77 |
| 2020 | 24 | 101 |
| 2021 | 10 | 111 |
| 2022 | 3 | 115 |
| 2023 | 1 | 190 |
| 2024 | 7 | 177 |
| 2025 | 1 | 146 |
Notable alumni
-
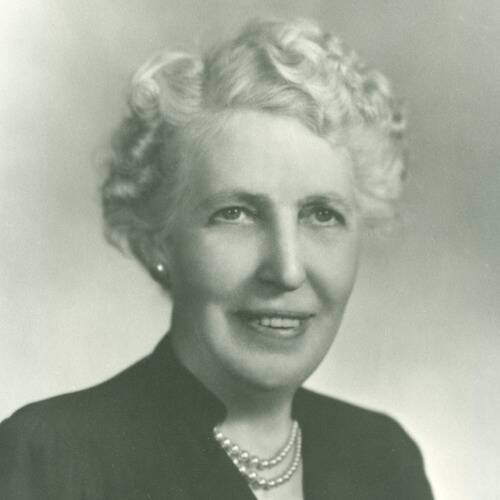
Ruth Thompson
- Occupations
- lawyerjudgepolitician
- Biography
-
Ruth Thompson was a Republican politician from the U.S. state of Michigan. A lawyer by profession, she served three terms in the United States House of Representatives from 1951 to 1957.

General info
| Founded | 1911 |
|---|---|
| Total FTE staff | 493 |
| Carnegie classification | Master's Colleges & Universities: Medium Programs |
Location and contacts
| Address | 1020 S Washington St Owosso, Michigan, 48867-8956 United States |
|---|---|
| City population | 81,000 |
| Phone | 8554877888 |
| Fax | +1 (313) 425 3777 |