Fisk University: Statistics
Updated:


| Position | Category |
|---|---|
| #2597 of 14,131 | In the World |
| #715 of 2,597 | In North America |
| #655 of 2,496 | In the United States |
| #17 of 56 | In Tennessee |
| #5 of 12 | In Nashville |
| #1624 of 3,183 | For Condensed Matter Physics |
Quick Review
- Acceptance rate
- 58%
- Undergraduates
- 950
- Graduates
- 55
- Male:Female Ratio
- 31:69
- Control
- Private
not-for-profit - Highest Degree
- Master's degree
- Website
- www.fisk.edu
Fisk University Acceptance rate and admissions statistics
Fisk University has an acceptance rate of 58% and is among the top 20% of the most difficult universities to gain admission to in the United States. The university reports the admission statistics without distinguishing between local and international students.
| Total | Men | Women | |
|---|---|---|---|
| Acceptance Rate | 58% | 49% | 65% |
| Applicants | 7,982 | 2,530 | 5,195 |
| Admissions | 4,622 | 1,242 | 3,380 |
| Freshmen enrolled full time | 314 | 94 | 220 |
| Freshmen enrolled part time | 6 | 3 | 3 |
10 students enrolled in some distance education courses.
SAT scores
Among admitted applicants
98 or 52%
submitted SAT
25% of them
had 1160
or below
75% of them
had 1480
or below
Typical SAT scores of first-years in Fisk University are 1160-1480 (middle 50% range).
ACT scores
Among admitted applicants
79 or 25%
submitted ACT
25% of them
had 20
or below
75% of them
had 25
or below
Typical ACT scores of first-years in Fisk University are 20-25 (middle 50% range).
Admissions requirements
| Secondary school GPA | Required |
|---|---|
| Secondary school record | Required |
| TOEFL | Required |
| College-preparatory program | Considered but not required |
| Recommendations | Considered but not required |
| SAT/ACT | Considered but not required |
| Secondary school rank | Considered but not required |
| Formal demonstration of competencies | Neither required nor recommended |
| Other Tests | Neither required nor recommended |
Enrollment demographics by race or ethnicity
| Black or African American | 827 (82%) |
|---|---|
| Race or Ethnicity unknown | 88 (9%) |
| Nonresident Alien | 62 (6%) |
| Asian | 11 (1%) |
| Two or more races | 10 (1%) |
| Hispanic | 7 (0.7%) |
Costs per year: Tuition, Housing, Fees
The average net cost to attend Fisk University is $19,836 per year, calculated as the sum of the average cost of tuition, room and board, books, and supplies, reduced by the amount of average financial aid received.
The final cost of attendance varies for each student based on household income, residency, program, and other factors.
Average costs by household income
| <$30K | $21,410 |
|---|---|
| $30-48K | $24,865 |
| $48-75K | $27,075 |
| $75-110K | $35,437 |
| $110K+ | $30,281 |
Tuition and fees
| Undergraduates | Graduates | |
|---|---|---|
| Tuition in-district | $22,320 | $22,590 |
| Tuition in-state | $22,320 | $22,590 |
| Tuition out-of-state | $22,320 | $22,590 |
| Fee in-district | $1,978 | $989 |
| Fee in-state | $1,978 | $989 |
| Fee out-of-state | $1,978 | $989 |
Room and board costs
| Dormitory capacity | 894 |
|---|---|
| Combined charge for room and board | $11,698 |
| Room charge | $6,568 |
| Meal charge | $5,130 |
Fisk University majors
Fisk University has granted 129 bachelor's degrees across 16 programs and 2 master's across 2 programs. Below is a table with majors that lead to degrees at Fisk University.
| Major | Bachelor | Master |
|---|---|---|
| Biology & Biological Sciences, General | 33 | 1 |
| Business & Commerce, General | 25 | |
| Psychology, General | 23 | |
| Biochemistry and Molecular Biology | 10 | |
| Political Science and Government, Other | 10 | |
| Computer and Information Sciences, General | 7 | |
| English Language and Literature, General | 4 | |
| Physics, General | 3 | 1 |
| Art & Art Studies, General | 3 | |
| Criminal Justice and Corrections, General | 2 | |
| History, General | 2 | |
| Mathematics, General | 2 | |
| Special Education and Teaching, General | 2 | |
| Chemistry, General | 1 | |
| General Studies | 1 | |
| Music Teacher Education | 1 | |
| Grand Total | 129 | 2 |
Fisk University has a graduation rate of 44%, which is among the 31% lowest for universities in the US.
| Total | Men | Women | |
|---|---|---|---|
| Graduation rate | 44% | 36% | 48% |
| |||
Publications & Citations
Fisk University has published 2,031 scientific papers with 45,731 citations received. The research profile covers a range of fields, including Physics, Engineering, Quantum and Particle physics, Chemistry, Materials Science, Biology, Computer Science, Environmental Science, Optical Engineering, and Organic Chemistry.
Publication / Citation count by topic
Annual publication & citation counts
| Year | Publications | Citations |
|---|---|---|
| 1992 | 13 | 54 |
| 1993 | 27 | 88 |
| 1994 | 22 | 121 |
| 1995 | 30 | 118 |
| 1996 | 43 | 139 |
| 1997 | 41 | 153 |
| 1998 | 46 | 152 |
| 1999 | 39 | 200 |
| 2000 | 21 | 220 |
| 2001 | 32 | 299 |
| 2002 | 39 | 343 |
| 2003 | 35 | 342 |
| 2004 | 43 | 399 |
| 2005 | 58 | 561 |
| 2006 | 73 | 586 |
| 2007 | 62 | 618 |
| 2008 | 56 | 700 |
| 2009 | 59 | 766 |
| 2010 | 64 | 899 |
| 2011 | 57 | 1190 |
| 2012 | 60 | 1440 |
| 2013 | 66 | 1750 |
| 2014 | 71 | 1947 |
| 2015 | 59 | 2347 |
| 2016 | 59 | 2819 |
| 2017 | 79 | 2799 |
| 2018 | 51 | 3668 |
| 2019 | 75 | 3160 |
| 2020 | 74 | 3834 |
| 2021 | 78 | 3765 |
| 2022 | 51 | 2871 |
| 2023 | 88 | 2954 |
| 2024 | 51 | 2814 |
Fisk University alumni
-
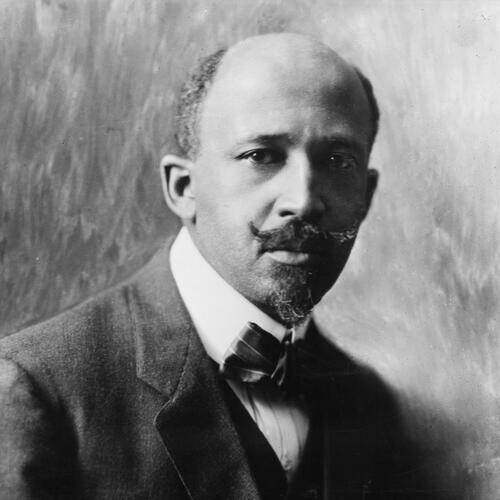
W. E. B. Du Bois

- Occupations
- sociologistteacherwriterjournalistart historian
- Biography
-
William Edward Burghardt Du Bois was an American sociologist, socialist, historian, and Pan-Africanist civil rights activist.
-
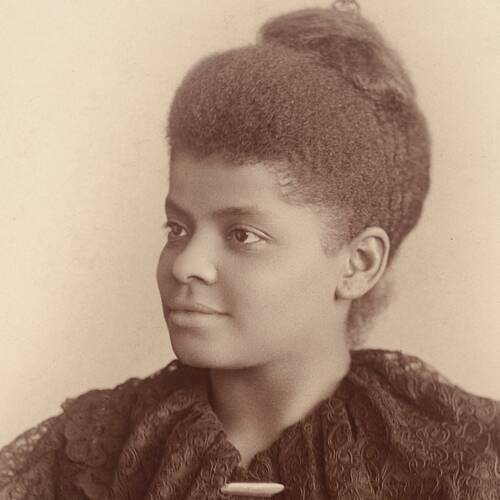
Ida B. Wells

- Occupations
- human rights activistsociologistsuffragistwriterjournalist
- Biography
-
Ida Bell Wells-Barnett was an American investigative journalist, sociologist, educator, and early leader in the civil rights movement. She was one of the founders of the National Association for the Advancement of Colored People (NAACP). Wells dedicated her career to combating prejudice and violence, and advocating for African-American equality—especially that of women.
-
John Lewis

- Enrolled in Fisk University
- In 1967 graduated with Bachelor of Arts
- Occupations
- politicianchairpersonhuman rights activist
- Biography
-
John Robert Lewis was an American civil rights activist and politician who served in the United States House of Representatives for Georgia's 5th congressional district from 1987 until his death in 2020. He participated in the 1960 Nashville sit-ins and the Freedom Rides, was the chairman of the Student Nonviolent Coordinating Committee (SNCC) from 1963 to 1966, and was one of the "Big Six" leaders of groups who organized the 1963 March on Washington. Fulfilling many key roles in the civil rights movement and its actions to end legalized racial segregation in the United States, in 1965 Lewis led the first of three Selma to Montgomery marches across the Edmund Pettus Bridge where, in an incident that became known as Bloody Sunday, state troopers and police attacked Lewis and the other marchers.
-
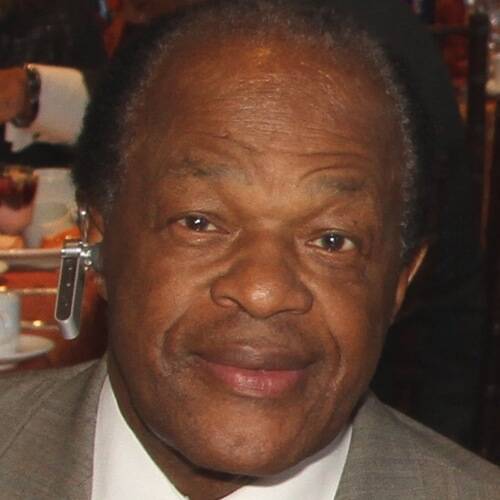
Marion Barry

- Occupations
- politicianhuman rights activist
- Biography
-
Marion Shepilov Barry was an American politician who served as mayor of the District of Columbia from 1979 to 1991 and 1995 to 1999. A Democrat, Barry had served three tenures on the Council of the District of Columbia, representing as an at-large member from 1975 to 1979, in Ward 8 from 1993 to 1995, and again from 2005 to 2014.


General info
| Founded | 1866 |
|---|---|
| Motto | Her sons and daughters are forever on the altar |
| Colors | gold, blue |
| Academic calendar | August to April |
| Total FTE staff | 196 |
| Carnegie classification | Baccalaureate Colleges: Arts & Sciences Focus |
Location and contacts
| Address | 1000 17th Ave North Nashville, Tennessee, 37208-4501 United States |
|---|---|
| City population | 689,000 |
| Phone | 6153298500 |
