Lindenwood University: Statistics
Updated:
| Position | Category |
|---|---|
| #2870 of 14,131 | In the World |
| #808 of 2,597 | In North America |
| #740 of 2,496 | In the United States |
| #16 of 67 | In Missouri |
| #689 of 1,114 | For Military science |
| Top50% | For 11 other topics |
Quick Review
- Acceptance rate
- 57%
- Undergraduates
- 4,663
- Graduates
- 2,163
- Male:Female Ratio
- 35:65
- Control
- Private
not-for-profit - Highest Degree
- Doctor's degree
- Website
- lindenwood.edu
Lindenwood University Acceptance rate and admissions statistics
Lindenwood University has an acceptance rate of 57% and is among the top 20% of the most difficult universities to gain admission to in the United States. The university reports the admission statistics without distinguishing between local and international students.
| Total | Men | Women | |
|---|---|---|---|
| Acceptance Rate | 57% | 50% | 54% |
| Applicants | 7,966 | 1,919 | 3,208 |
| Admissions | 4,528 | 956 | 1,717 |
| Freshmen enrolled full time | 621 | 232 | 389 |
| Freshmen enrolled part time | 17 | 7 | 10 |
2,994 students enrolled in some distance education courses.
3,177 enrolled exclusively in distance education.
ACT scores
Among admitted applicants
37 or 6%
submitted ACT
25% of them
had 22
or below
75% of them
had 28
or below
Typical ACT scores of first-years in Lindenwood University are 22-28 (middle 50% range).
Admissions requirements
| Secondary school GPA | Required |
|---|---|
| TOEFL | Required |
| College-preparatory program | Considered but not required |
| Recommendations | Considered but not required |
| SAT/ACT | Considered but not required |
| Secondary school rank | Considered but not required |
| Secondary school record | Considered but not required |
| Formal demonstration of competencies | Neither required nor recommended |
| Other Tests | Neither required nor recommended |
Enrollment demographics by race or ethnicity
| White | 4201 (62%) |
|---|---|
| Black or African American | 1015 (15%) |
| Race or Ethnicity unknown | 553 (8%) |
| Hispanic | 330 (5%) |
| Nonresident Alien | 305 (4%) |
| Two or more races | 266 (4%) |
| Asian | 106 (2%) |
| Native Hawaiian or other Pacific Islander | 28 (0.4%) |
| American Indian or Alaska Native | 4 (0.1%) |
Costs per year: Tuition, Housing, Fees
The average net cost to attend Lindenwood University is $20,901 per year, calculated as the sum of the average cost of tuition, room and board, books, and supplies, reduced by the amount of average financial aid received.
The final cost of attendance varies for each student based on household income, residency, program, and other factors.
Average costs by household income
| <$30K | $15,678 |
|---|---|
| $30-48K | $14,701 |
| $48-75K | $17,603 |
| $75-110K | $20,760 |
| $110K+ | $23,821 |
Tuition and fees
| Undergraduates | Graduates | |
|---|---|---|
| Tuition in-district | $19,900 | $10,746 |
| Tuition in-state | $19,900 | $10,746 |
| Tuition out-of-state | $19,900 | $10,746 |
| Fee in-district | $1,700 | $500 |
| Fee in-state | $1,700 | $500 |
| Fee out-of-state | $1,700 | $500 |
Room and board costs
| Dormitory capacity | 2,541 |
|---|---|
| Combined charge for room and board | $10,200 |
| Room charge | $7,180 |
| Meal charge | $4,520 |
Lindenwood University majors
Lindenwood University has granted 960 bachelor's degrees across 61 programs, 559 master's across 31 programs, and 19 doctorate degrees in Curriculum and Instruction. Below is a table with majors that lead to degrees at Lindenwood University.
| Major | Bachelor | Master | Doctoral |
|---|---|---|---|
| Business & Commerce, General | 155 | 119 | |
| Education, Other | 36 | 47 | |
| Creative Writing | 81 | ||
| Exercise Science and Kinesiology | 56 | 17 | |
| Criminal Justice & Safety Studies | 62 | ||
| Computer Graphics | 43 | 5 | |
| Accounting | 30 | 17 | |
| Mental Health Counseling & Counselor | 47 | ||
| Multi- & Interdisciplinary Studies, Other | 41 | ||
| Art History, Criticism and Conservation | 5 | 34 | |
| Psychology, General | 38 | ||
| Marketing & Marketing Management, General | 35 | ||
| Teacher Education, Multiple Levels | 30 | ||
| Computer and Information Systems Security & Auditing & Information Assurance | 28 | ||
| Biology & Biological Sciences, General | 27 | ||
| Finance, General | 27 | ||
| Health & Health Care Administration & Management | 12 | 14 | |
| Sport and Fitness Administration & Management | 24 | ||
| Human Resources Management & Personnel Administration, General | 17 | 5 | |
| Fashion Merchandising | 10 | 10 | |
| Game and Interactive Media Design | 12 | 8 | |
| Curriculum and Instruction | 19 | ||
| Public Health, General | 18 | ||
| Mass Communication & Media Studies | 17 | ||
| Criminology | 16 | ||
| Chemistry, General | 15 | ||
| English Language and Literature, General | 15 | ||
| Dance, General | 14 | ||
| Information Technology | 14 | ||
| Early Childhood Education and Teaching | 13 | ||
| Computer & Information Technology Services Administration and Management, Other | 4 | 8 | |
| Educational Leadership and Administration, General | 12 | ||
| Public Administration | 12 | ||
| Secondary School Administration & Principalship | 12 | ||
| Social Work | 12 | ||
| Sociology, General | 12 | ||
| Cell & Cellular and Molecular Biology | 11 | ||
| Computer and Information Sciences, General | 11 | ||
| Organizational Leadership | 11 | ||
| Reading Teacher Education | 11 | ||
| Economics, General | 10 | ||
| Speech Communication and Rhetoric | 10 | ||
| Physical Education Teaching and Coaching | 9 | ||
| Web Page, Digital & Multimedia and Information Resources Design | 9 | ||
| Cinematography and Film & Video Production | 8 | ||
| Dramatic & Theatre Arts and Stagecraft, Other | 8 | ||
| Education & Teaching of Individuals with Autism | 8 | ||
| Education & Teaching of the Gifted and Talented | 8 | ||
| History, General | 8 | ||
| Political Science and Government, General | 8 | ||
| Special Education and Teaching, General | 8 | ||
| Fashion & Apparel Design | 6 | 1 | |
| Advertising | 6 | ||
| International Relations and Affairs | 6 | ||
| Mathematics, General | 6 | ||
| Non-Profit & Public & Organizational Management | 6 | ||
| Therapeutic Recreation & Recreational Therapy | 6 | ||
| Emergency Medical Technology & Technician (EMT Paramedic) | 5 | ||
| Acting | 4 | ||
| Drama and Dramatics & Theatre Arts, General | 4 | ||
| Health Services & Allied Health & Health Sciences, General | 4 | ||
| Higher Education & Higher Education Administration | 4 | ||
| Art & Art Studies, General | 3 | ||
| Computer Systems Analysis & Analyst | 3 | ||
| Education, General | 3 | ||
| Environmental Science | 3 | ||
| Music, General | 3 | ||
| Philosophy | 3 | ||
| Technical Theatre & Theatre Design and Technology | 3 | ||
| Business Administration, Management and Operations, Other | 2 | ||
| Fine Arts and Art Studies, Other | 2 | ||
| Parks, Recreation, and Leisure Studies | 2 | ||
| Sales, Distribution, and Marketing Operations, General | 2 | ||
| Business Administration and Management, General | 1 | ||
| Intermedia & Multimedia | 1 | ||
| International Business & Trade & Commerce | 1 | ||
| Music Management | 1 | ||
| Music Teacher Education | 1 | ||
| Radio and Television | 1 | ||
| Sports, Kinesiology, and Physical Education & Fitness, General | 1 | ||
| Statistics, Other | 1 | ||
| Grand Total | 960 | 559 | 19 |
Lindenwood University has a graduation rate of 49%, which is among the 39% lowest for universities in the US.
| Total | Men | Women | |
|---|---|---|---|
| Graduation rate | 49% | 40% | 58% |
| |||
Publications & Citations
Lindenwood University has published 1,157 scientific papers with 21,710 citations received. The research profile covers a range of fields, including Liberal Arts & Social Sciences, Political Science, Law, Sociology, Medicine, Environmental Science, Computer Science, Biology, Philosophy, and Psychology.
Publication / Citation count by topic
Annual publication & citation counts
| Year | Publications | Citations |
|---|---|---|
| 1993 | 0 | 8 |
| 1994 | 0 | 15 |
| 1995 | 1 | 11 |
| 1996 | 2 | 19 |
| 1997 | 3 | 36 |
| 1998 | 7 | 39 |
| 1999 | 2 | 69 |
| 2000 | 3 | 69 |
| 2001 | 7 | 89 |
| 2002 | 0 | 125 |
| 2003 | 7 | 139 |
| 2004 | 4 | 225 |
| 2005 | 10 | 191 |
| 2006 | 12 | 249 |
| 2007 | 7 | 270 |
| 2008 | 6 | 319 |
| 2009 | 16 | 343 |
| 2010 | 33 | 394 |
| 2011 | 36 | 478 |
| 2012 | 43 | 497 |
| 2013 | 46 | 598 |
| 2014 | 49 | 640 |
| 2015 | 63 | 726 |
| 2016 | 52 | 821 |
| 2017 | 74 | 867 |
| 2018 | 86 | 1047 |
| 2019 | 74 | 1338 |
| 2020 | 94 | 1697 |
| 2021 | 48 | 1869 |
| 2022 | 53 | 1847 |
| 2023 | 101 | 2063 |
| 2024 | 88 | 2356 |
| 2025 | 60 | 2226 |
Lindenwood University alumni
-
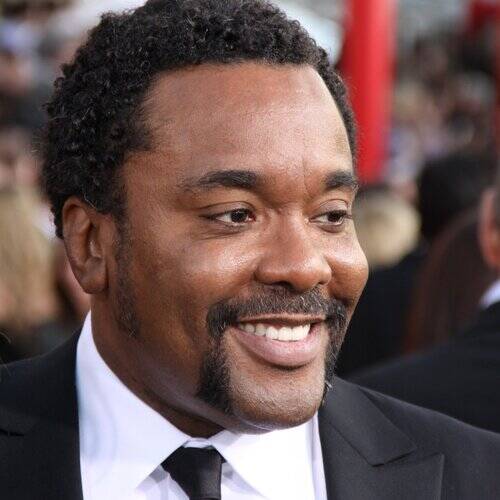
Lee Daniels
- Occupations
- film producerfilm actorshowrunnerfilm directortelevision producer
- Biography
-
Lee Daniels is an American film producer, director, and screenwriter. He made his directorial film debut with Shadowboxer (2005), followed by Precious (2009) which earned him Academy Award nominations for Best Director and Best Picture. He has since directed The Paperboy (2012, which he co-wrote), The Butler (2013), The United States vs. Billie Holiday (2021), and The Deliverance (2024). He also produced the films Monster's Ball (2001), The Woodsman (2004), Tennessee (2008), Pimp (2018), and Concrete Cowboy (2020).
-
Marjorie Finlay
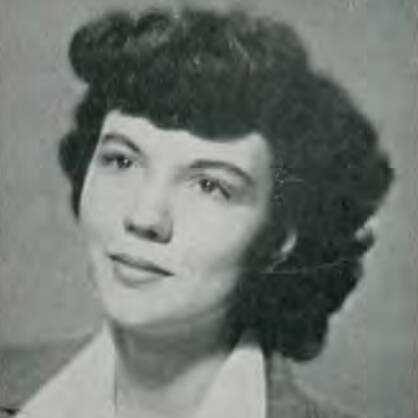
- Enrolled in Lindenwood University
- In 1949 graduated with Bachelor of Music
- Occupations
- master of ceremoniesopera singertelevision personalityradio personality
- Biography
-
Marjorie Moehlenkamp Finlay was an American opera singer and television personality. A coloratura soprano, Finlay performed concert and opera singing. After winning a talent contest in 1950, she toured on the ABC radio network show Music With the Girls. Finlay later had her own television program and served as an MC for El Show Pan-Americano in Puerto Rico. She toured South America and released an album in Mexico. She is the maternal grandmother of singer-songwriter Taylor Swift, who dedicated her song "Marjorie" to her. Her vocals are also featured in the background of the song.
-
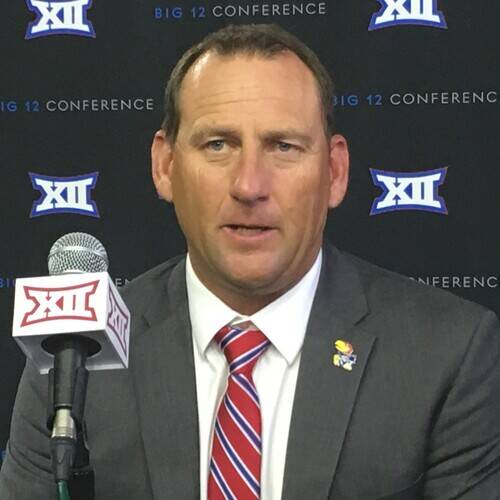
Wesley Bell

- Enrolled in Lindenwood University
- 2011-2018 graduated with Bachelor of Arts
- Occupations
- lawyerjudgepolitician
- Biography
-
Wesley Jonell-Cleavon Bell is an American attorney and politician serving as the U.S. representative for Missouri's 1st congressional district since 2025. A member of the Democratic Party, he previously served as prosecuting attorney for St. Louis County, Missouri, from 2019 to 2025.
-
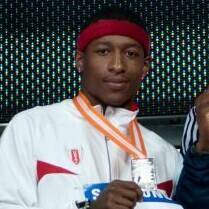
Shandi Finnessey

- Occupations
- television presenterbeauty pageant contestantmodel
- Biography
-
Shandi Ren Finnessey is an American actress, model, TV host and beauty pageant titleholder. She is best known for winning the Miss USA title, as Miss Missouri USA. She previously held the title of Miss Missouri 2002 and competed in Miss America, where she won a preliminary award. She placed as first runner-up at the Miss Universe 2004 competition.


General info
| Alternative names | LU |
|---|---|
| Founded | 1827 |
| Motto | Like No Other |
| Colors | black, gold |
| Total FTE staff | 832 |
| Carnegie classification | Master's Colleges & Universities: Larger Programs |
Location and contacts
| Address | 209 S Kingshighway St Saint Charles, Missouri, 63301-1695 United States |
|---|---|
| City population | 70,000 |
| Phone | 6369492000 |