Suffolk University: Statistics
Updated:
| Position | Category |
|---|---|
| #1315 of 14,131 | In the World |
| #358 of 2,597 | In North America |
| #322 of 2,496 | In the United States |
| #19 of 88 | In Massachusetts |
| #5 of 24 | In Boston |
| #181 of 1,041 | For Intellectual Property and Patent Law |
| Top50% | For 85 other topics |
Quick Review
- Acceptance rate
- 82%
- Undergraduates
- 4,326
- Graduates
- 2,030
- Male:Female Ratio
- 36:64
- Control
- Private
not-for-profit - Highest Degree
- Doctor's degree
- Website
- www.suffolk.edu
Suffolk University Acceptance rate and admissions statistics
Suffolk University has an acceptance rate of 82% and is in the middle in terms of the difficulty of admission among universities in the United States. The university reports the admission statistics without distinguishing between local and international students.
| Total | Men | Women | |
|---|---|---|---|
| Acceptance Rate | 82% | 81% | 85% |
| Applicants | 10,308 | 3,257 | 6,221 |
| Admissions | 8,487 | 2,626 | 5,279 |
| Freshmen enrolled full time | 922 | 290 | 621 |
| Freshmen enrolled part time | 1 | 1 |
2,162 students enrolled in some distance education courses.
31 enrolled exclusively in distance education.
SAT scores
Among admitted applicants
115 or 12%
submitted SAT
25% of them
had 1090
or below
75% of them
had 1300
or below
Typical SAT scores of first-years in Suffolk University are 1090-1300 (middle 50% range).
ACT scores
Among admitted applicants
19 or 2%
submitted ACT
25% of them
had 24
or below
75% of them
had 28
or below
Typical ACT scores of first-years in Suffolk University are 24-28 (middle 50% range).
Admissions requirements
| College-preparatory program | Required |
|---|---|
| Recommendations | Required |
| Secondary school record | Required |
| SAT/ACT | Considered but not required |
| Secondary school GPA | Considered but not required |
| Secondary school rank | Considered but not required |
| TOEFL | Considered but not required |
| Formal demonstration of competencies | Neither required nor recommended |
| Other Tests | Neither required nor recommended |
Enrollment demographics by race or ethnicity
| White | 3198 (50%) |
|---|---|
| Hispanic | 856 (13%) |
| Nonresident Alien | 848 (13%) |
| Black or African American | 528 (8%) |
| Asian | 451 (7%) |
| Race or Ethnicity unknown | 294 (5%) |
| Two or more races | 165 (3%) |
| American Indian or Alaska Native | 6 (0.1%) |
| Native Hawaiian or other Pacific Islander | 3 (0%) |
Costs per year: Tuition, Housing, Fees
The average net cost to attend Suffolk University is $33,832 per year, calculated as the sum of the average cost of tuition, room and board, books, and supplies, reduced by the amount of average financial aid received.
The final cost of attendance varies for each student based on household income, residency, program, and other factors.
Average costs by household income
| <$30K | $24,745 |
|---|---|
| $30-48K | $25,711 |
| $48-75K | $25,702 |
| $75-110K | $29,654 |
| $110K+ | $36,264 |
Tuition and fees
| Undergraduates | Graduates | |
|---|---|---|
| Tuition in-district | $46,954 | $37,944 |
| Tuition in-state | $46,954 | $37,944 |
| Tuition out-of-state | $46,954 | $37,944 |
| Fee in-district | $596 | $504 |
| Fee in-state | $596 | $504 |
| Fee out-of-state | $596 | $504 |
Room and board costs
| Dormitory capacity | 1,580 |
|---|---|
| Combined charge for room and board | $22,196 |
| Room charge | $17,854 |
| Meal charge | $4,342 |
Suffolk University majors
Suffolk University has granted 988 bachelor's degrees across 51 programs, 569 master's across 27 programs, and 416 doctorate degrees across 4 programs. Below is a table with majors that lead to degrees at Suffolk University.
| Major | Bachelor | Master | Doctoral |
|---|---|---|---|
| Law | 394 | ||
| Business Administration and Management, General | 66 | 104 | |
| Marketing & Marketing Management, General | 100 | ||
| Psychology, General | 89 | ||
| Management Science | 1 | 83 | |
| Accounting | 34 | 31 | |
| Finance, General | 62 | ||
| Legal Studies | 62 | ||
| Political Science and Government, General | 48 | 6 | |
| Management Sciences and Quantitative Methods, Other | 52 | ||
| Public Administration | 48 | ||
| Business Statistics | 46 | ||
| Entrepreneurship & Entrepreneurial Studies | 39 | ||
| Corrections and Criminal Justice, Other | 38 | ||
| Biology & Biological Sciences, General | 37 | ||
| Advanced Legal Research & Studies, General | 36 | ||
| Information Science & Studies | 34 | ||
| Business & Managerial Economics | 17 | 10 | |
| Interior Design | 26 | ||
| Journalism | 26 | ||
| Public Relations, Advertising, and Applied Communication, Other | 25 | ||
| Health & Health Care Administration & Management | 24 | ||
| International Relations and Affairs | 22 | 1 | |
| Mental Health Counseling & Counselor | 22 | ||
| Advertising | 21 | ||
| Computer Science | 21 | ||
| English Language and Literature & Letters, Other | 21 | ||
| Marketing, Other | 8 | 13 | |
| Drama and Dramatics & Theatre Arts, General | 20 | ||
| Graphic Design | 15 | 4 | |
| Multi- & Interdisciplinary Studies, Other | 18 | ||
| Sociology, General | 18 | ||
| Criminal Justice & Police Science | 16 | ||
| Public Relations & Image Management | 16 | ||
| History, General | 14 | ||
| American & U.S. Law & Legal Studies & Jurisprudence | 13 | ||
| Radio and Television | 13 | ||
| Clinical Psychology | 4 | 7 | |
| Organizational Leadership | 11 | ||
| International Policy Analysis | 10 | ||
| Economics, General | 9 | ||
| Environmental Studies | 9 | ||
| Radiation Biology & Radiobiology | 9 | ||
| Clinical and Industrial Drug Development | 8 | ||
| Health Professions and Related Clinical Sciences, Other | 8 | ||
| Biochemistry | 7 | ||
| Financial Planning and Services | 7 | ||
| Interior Architecture | 7 | ||
| International and Intercultural Communication | 7 | ||
| Multi- & Interdisciplinary Studies, General | 7 | ||
| Fine & Studio Arts, General | 6 | ||
| Business & Commerce, General | 5 | ||
| Developmental and Child Psychology | 3 | 2 | |
| Environmental Science | 5 | ||
| Accounting and Finance | 3 | ||
| Art History, Criticism and Conservation | 3 | ||
| Health Services Administration | 3 | ||
| Philosophy | 3 | ||
| International Business & Trade & Commerce | 2 | ||
| Mathematics, General | 2 | ||
| Business Administration, Management and Operations, Other | 1 | ||
| Chemistry, General | 1 | ||
| Criminology | 1 | ||
| Higher Education & Higher Education Administration | 1 | ||
| History, Other | 1 | ||
| Humanities & Humanistic Studies | 1 | ||
| Management Information Systems, General | 1 | ||
| Political Science and Government, Other | 1 | ||
| Science, Technology and Society | 1 | ||
| Social Sciences, General | 1 | ||
| Taxation | 1 | ||
| Visual and Performing Arts, General | 1 | ||
| Grand Total | 988 | 569 | 416 |
Suffolk University has a graduation rate of 61%, which is among the 38% highest for universities in the US.
| Total | Men | Women | |
|---|---|---|---|
| Graduation rate | 61% | 57% | 64% |
| |||
Publications & Citations
Suffolk University has published 7,271 scientific papers with 155,497 citations received. The research profile covers a range of fields, including Liberal Arts & Social Sciences, Political Science, Law, Computer Science, Environmental Science, Business, Biology, Medicine, Sociology, and Psychology.
Publication / Citation count by topic
Annual publication & citation counts
| Year | Publications | Citations |
|---|---|---|
| 1993 | 56 | 290 |
| 1994 | 68 | 316 |
| 1995 | 64 | 385 |
| 1996 | 74 | 412 |
| 1997 | 98 | 458 |
| 1998 | 121 | 594 |
| 1999 | 134 | 677 |
| 2000 | 101 | 831 |
| 2001 | 104 | 855 |
| 2002 | 118 | 1129 |
| 2003 | 102 | 1310 |
| 2004 | 153 | 1516 |
| 2005 | 154 | 1934 |
| 2006 | 189 | 2260 |
| 2007 | 288 | 2691 |
| 2008 | 238 | 3158 |
| 2009 | 284 | 3962 |
| 2010 | 283 | 4440 |
| 2011 | 341 | 4853 |
| 2012 | 316 | 5561 |
| 2013 | 322 | 6106 |
| 2014 | 272 | 6846 |
| 2015 | 283 | 7139 |
| 2016 | 207 | 7333 |
| 2017 | 219 | 7567 |
| 2018 | 243 | 8074 |
| 2019 | 261 | 9167 |
| 2020 | 274 | 10460 |
| 2021 | 252 | 11025 |
| 2022 | 224 | 10581 |
| 2023 | 198 | 10832 |
| 2024 | 177 | 10434 |
| 2025 | 136 | 9112 |
Suffolk University alumni
-
Eliza Dushku

- Occupations
- stage actortelevision actorvoice actoractorfilm actor
- Biography
-
Eliza Patricia Dushku is an American and Albanian retired actress. Dushku starred as Faith in the supernatural drama series Buffy the Vampire Slayer (1998–2003) and its spin-off series Angel (2000–2003). She also had lead roles in the Fox supernatural drama series Tru Calling (2003–2005) and the Fox science fiction series Dollhouse (2009–2010), for which she was a producer.
-
Jenna Marbles

- Enrolled in Suffolk University
- Studied psychology
- Occupations
- podcasterYouTuber
- Biography
-
Jenna Nicole Mourey, better known as Jenna Marbles, is an American former YouTuber. Over the span of ten years, her YouTube channel has accumulated approximately 1.8 billion video views and, at its peak, over 20 million subscribers. After apologizing for a series of accusations involving content in her older videos, Marbles announced her indefinite hiatus from the platform in 2020.
-
Frank Caprio
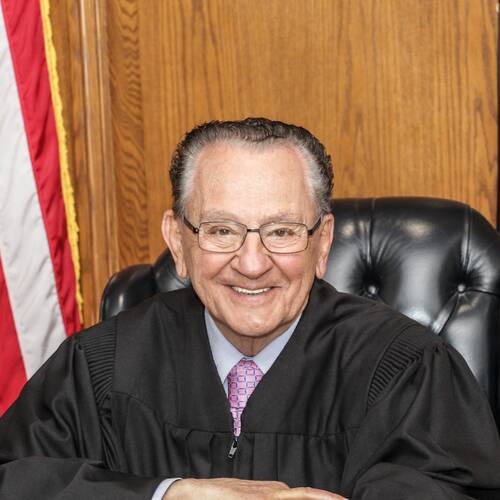
- Enrolled in Suffolk University
- Graduated with Juris Doctor
- Occupations
- lawyerteachertelevision personalityjudge
- Biography
-
Frank Caprio was an American judge and politician who served as the chief judge of the municipal court of Providence, Rhode Island, and chairman of the Rhode Island Board of Governors for Higher Education. His judicial work was televised on the program Caught in Providence. He also made appearances in the series Parking Wars, adjudicating several cases of traffic violations. The Caught in Providence YouTube channel has 2.92 million subscribers. In 2017, his videos in the courtroom went viral, with more than 15 million views. By 2022, views of Caught in Providence neared 500 million. He became well known for his empathy and light humor in court. A Democrat, Caprio served on the Providence City Council in the 1960s, and unsuccessfully ran for both Lieutenant Governor and Attorney General.
-
Paul Benedict
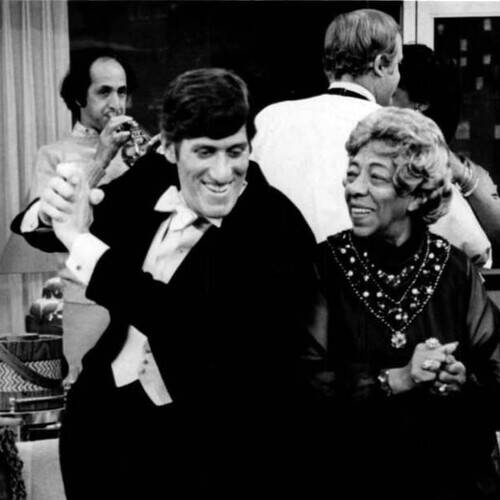
- Occupations
- theatrical directoractortelevision actor
- Biography
-
Paul Bernard Benedict was an American actor who made numerous appearances in television and films, beginning in 1965. He was known for his roles as The Number Painter on the PBS children's show Sesame Street and as the English neighbor Harry Bentley on the CBS sitcom The Jeffersons.


General info
| Alternative names | SU |
|---|---|
| Founded | 1906 |
| Motto | Honestas et Diligentia Honesty and Diligence |
| Academic calendar | September to May (September - December; January-May). Also Summer Session (July-August) |
| Total FTE staff | 1,061 |
| Carnegie classification | Doctoral/Professional Universities |
Location and contacts
| Address | 73 Tremont St. Boston, Massachusetts, 02108-3901 United States |
|---|---|
| City population | 676,000 |
| Phone | 6175738754 |