Lehigh University: Statistics
Updated:
| Position | Category |
|---|---|
| #493 of 14,131 | In the World |
| #180 of 2,597 | In North America |
| #157 of 2,496 | In the United States |
| #8 of 155 | In Pennsylvania |
| #1 of 3 | In Bethlehem |
| #76 of 1,009 | For Polymer science and Plastics engineering |
| Top50% | For 176 other topics |
Quick Review
- Acceptance rate
- 26%
- Undergraduates
- 5,911
- Graduates
- 1,781
- Male:Female Ratio
- 51:49
- Control
- Private
not-for-profit - Highest Degree
- Doctor's degree
- Website
- lehigh.edu
Lehigh University Acceptance rate and admissions statistics
Lehigh University has an acceptance rate of 26% and is among the top 7% of the most difficult universities to gain admission to in the United States. The university reports the admission statistics without distinguishing between local and international students.
| Total | Men | Women | |
|---|---|---|---|
| Acceptance Rate | 26% | 24% | 28% |
| Applicants | 20,396 | 10,556 | 9,834 |
| Admissions | 5,289 | 2,551 | 2,736 |
| Freshmen enrolled full time | 1,501 | 795 | 706 |
290 students enrolled in some distance education courses.
377 enrolled exclusively in distance education.
SAT scores
Among admitted applicants
445 or 30%
submitted SAT
25% of them
had 1370
or below
75% of them
had 1500
or below
Typical SAT scores of first-years in Lehigh University are 1370-1500 (middle 50% range).
ACT scores
Among admitted applicants
137 or 9%
submitted ACT
25% of them
had 31
or below
75% of them
had 34
or below
Typical ACT scores of first-years in Lehigh University are 31-34 (middle 50% range).
Admissions requirements
| Recommendations | Required |
|---|---|
| Secondary school GPA | Required |
| Secondary school record | Required |
| TOEFL | Required |
| College-preparatory program | Considered but not required |
| SAT/ACT | Considered but not required |
| Formal demonstration of competencies | Neither required nor recommended |
| Other Tests | Neither required nor recommended |
| Secondary school rank | Neither required nor recommended |
Enrollment demographics by race or ethnicity
| White | 4392 (57%) |
|---|---|
| Nonresident Alien | 995 (13%) |
| Hispanic | 766 (10%) |
| Asian | 721 (9%) |
| Black or African American | 346 (5%) |
| Two or more races | 273 (4%) |
| Race or Ethnicity unknown | 188 (2%) |
| Native Hawaiian or other Pacific Islander | 6 (0.1%) |
Costs per year: Tuition, Housing, Fees
The average net cost to attend Lehigh University is $34,154 per year, calculated as the sum of the average cost of tuition, room and board, books, and supplies, reduced by the amount of average financial aid received.
The final cost of attendance varies for each student based on household income, residency, program, and other factors.
Average costs by household income
| <$30K | $16,917 |
|---|---|
| $30-48K | $17,140 |
| $48-75K | $18,722 |
| $75-110K | $22,184 |
| $110K+ | $48,751 |
Tuition and fees
| Undergraduates | Graduates | |
|---|---|---|
| Tuition in-district | $63,930 | $28,620 |
| Tuition in-state | $63,930 | $28,620 |
| Tuition out-of-state | $63,930 | $28,620 |
| Fee in-district | $1,050 | $220 |
| Fee in-state | $1,050 | $220 |
| Fee out-of-state | $1,050 | $220 |
Room and board costs
| Dormitory capacity | 3,068 |
|---|---|
| Combined charge for room and board | $17,220 |
| Room charge | $10,120 |
| Meal charge | $7,100 |
Lehigh University majors
Lehigh University has granted 1,371 bachelor's degrees across 64 programs, 489 master's across 50 programs, and 99 doctorate degrees across 25 programs. Below is a table with majors that lead to degrees at Lehigh University.
| Major | Bachelor | Master | Doctoral |
|---|---|---|---|
| Finance, General | 186 | 3 | |
| Computer Science | 148 | 18 | 2 |
| Mechanical Engineering | 89 | 20 | 17 |
| Industrial Engineering | 56 | 13 | 6 |
| Business Analytics | 26 | 42 | |
| Psychology, General | 63 | 1 | 3 |
| Biology & Biological Sciences, General | 64 | 2 | |
| Business & Commerce, General | 34 | 17 | |
| Business Administration and Management, General | 50 | ||
| Chemical Engineering | 37 | 10 | 3 |
| Marketing & Marketing Management, General | 47 | 2 | |
| Bioengineering and Biomedical Engineering | 34 | 10 | 4 |
| Business & Managerial Economics | 43 | ||
| Accounting | 40 | ||
| Political Science and Government, General | 36 | 2 | |
| Public Health Education and Promotion | 36 | 1 | |
| Electrical and Electronics Engineering | 21 | 14 | |
| Logistics, Materials, and Supply Chain Management | 26 | 7 | |
| Educational Leadership and Administration, General | 27 | 4 | |
| Civil Engineering, General | 23 | 5 | 1 |
| Computer Engineering, General | 20 | 6 | 1 |
| Mathematics, General | 16 | 7 | 1 |
| Multi- & Interdisciplinary Studies, General | 24 | ||
| Neuroscience | 24 | ||
| Journalism | 23 | ||
| Research and Experimental Psychology, Other | 14 | 8 | |
| Econometrics and Quantitative Economics | 15 | 6 | |
| Physics, General | 8 | 4 | 8 |
| Cognitive Science, General | 19 | ||
| Materials Engineering | 8 | 4 | 7 |
| Educational & Instructional Technology | 15 | 2 | |
| Architecture | 16 | ||
| Engineering & Industrial Management | 16 | ||
| Molecular Biology | 10 | 6 | |
| Polymer & Plastics Engineering | 14 | 2 | |
| Counselor Education & School Counseling and Guidance Services | 15 | ||
| English Language and Literature, General | 9 | 5 | 1 |
| Geological and Earth Sciences & Geosciences, Other | 12 | 3 | |
| Information Technology | 15 | ||
| Structural Engineering | 11 | 4 | |
| Design and Visual Communications, General | 14 | ||
| Environmental & Environmental Health Engineering | 8 | 6 | |
| International Relations and Affairs | 14 | ||
| Biochemistry | 13 | ||
| Chemistry, General | 7 | 1 | 5 |
| History, General | 8 | 4 | 1 |
| Special Education and Teaching, General | 11 | 2 | |
| Financial Mathematics | 12 | ||
| Environmental Studies | 11 | ||
| Data Science, General | 10 | ||
| Public Health, Other | 10 | ||
| Public Policy Analysis, General | 10 | ||
| Developmental and Child Psychology | 3 | 6 | |
| Sociology, General | 9 | ||
| Project Management | 8 | ||
| Engineering, Other | 7 | ||
| Anthropology, General | 6 | ||
| Applied Behavior Analysis | 6 | ||
| Chemical and Biomolecular Engineering | 6 | ||
| Elementary Education and Teaching | 6 | ||
| Epidemiology and Biostatistics | 6 | ||
| Philosophy | 6 | ||
| Statistics, General | 4 | 2 | |
| Applied Mathematics, General | 3 | 2 | |
| Entrepreneurial and Small Business Operations, Other | 5 | ||
| International & Globalization Studies | 5 | ||
| Management Science | 5 | ||
| Secondary Education and Teaching | 5 | ||
| Community Health and Preventive Medicine | 4 | ||
| Drama and Dramatics & Theatre Arts, General | 4 | ||
| Multi- & Interdisciplinary Studies, Other | 4 | ||
| African Studies | 3 | ||
| Astrophysics | 3 | ||
| Environmental & Natural Resources Management and Policy, General | 3 | ||
| Music, General | 3 | ||
| Women's Studies | 3 | ||
| Art History, Criticism and Conservation | 1 | ||
| Art & Art Studies, General | 1 | ||
| Asian Studies & Civilization | 1 | ||
| Chinese Language and Literature | 1 | ||
| Engineering Physics & Applied Physics | 1 | ||
| Evolutionary Biology | 1 | ||
| French Language and Literature | 1 | ||
| German Language and Literature | 1 | ||
| Latin American Studies | 1 | ||
| Pre-Optometry Studies | 1 | ||
| Religion & Religious Studies | 1 | ||
| Spanish Language and Literature | 1 | ||
| Technical and Scientific Communication | 1 | ||
| Grand Total | 1,371 | 489 | 99 |
Lehigh University has a graduation rate of 88%, which is among the 6% highest for universities in the US.
| Total | Men | Women | |
|---|---|---|---|
| Graduation rate | 88% | 85% | 91% |
| |||
Publications & Citations
Lehigh University is a world-class research university with 39,956 scientific papers published and 1,132,374 citations received. The research profile covers a range of fields, including Engineering, Physics, Chemistry, Biology, Quantum and Particle physics, Materials Science, Environmental Science, Liberal Arts & Social Sciences, Computer Science, and Organic Chemistry.
Publication / Citation count by topic
Annual publication & citation counts
| Year | Publications | Citations |
|---|---|---|
| 1993 | 506 | 5738 |
| 1994 | 438 | 6404 |
| 1995 | 537 | 6881 |
| 1996 | 620 | 7266 |
| 1997 | 607 | 7363 |
| 1998 | 500 | 7714 |
| 1999 | 547 | 9062 |
| 2000 | 534 | 9901 |
| 2001 | 576 | 10618 |
| 2002 | 731 | 12915 |
| 2003 | 723 | 14067 |
| 2004 | 719 | 14610 |
| 2005 | 858 | 17461 |
| 2006 | 867 | 19429 |
| 2007 | 894 | 21098 |
| 2008 | 952 | 24209 |
| 2009 | 1004 | 26355 |
| 2010 | 1035 | 29799 |
| 2011 | 1129 | 33474 |
| 2012 | 1027 | 36312 |
| 2013 | 1069 | 39667 |
| 2014 | 1098 | 43139 |
| 2015 | 1093 | 44868 |
| 2016 | 1063 | 46428 |
| 2017 | 1120 | 49016 |
| 2018 | 1126 | 52936 |
| 2019 | 1243 | 58375 |
| 2020 | 1379 | 67031 |
| 2021 | 1285 | 73324 |
| 2022 | 1238 | 69865 |
| 2023 | 1313 | 70625 |
| 2024 | 1114 | 69980 |
| 2025 | 822 | 62023 |
Lehigh University alumni
-
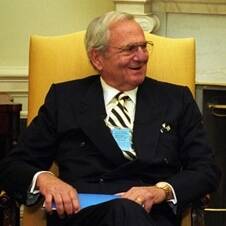
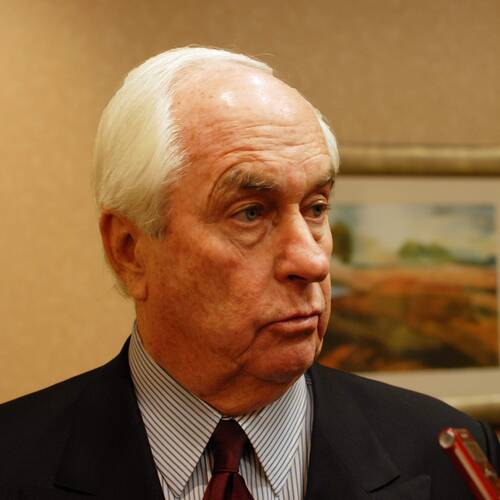
Lee Iacocca
- Enrolled in Lehigh University
- Studied industrial engineering
- Occupations
- autobiographerentrepreneurdiaristbusiness executiveengineer
- Biography
-
Lido Anthony "Lee" Iacocca was an American author, engineer, and an executive who developed the Ford Mustang, Continental Mark III, and Ford Pinto cars while at the Ford Motor Company in the 1960s, and then revived the Chrysler Corporation as its CEO during the 1980s. He was president of Chrysler from 1978 to 1991 and chairman and CEO from 1979 until his retirement at the end of 1992. He was one of the few executives to preside over the operations of two of the United States' Big Three automakers.
-
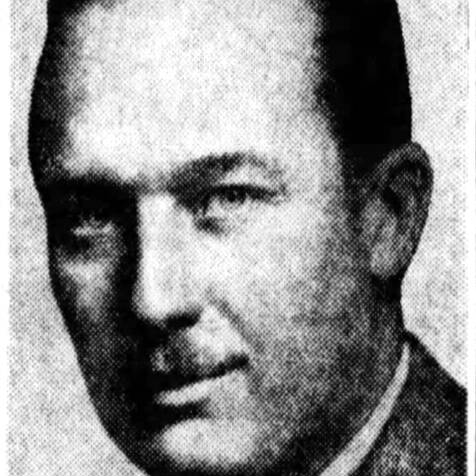
Fred Trump Jr
- Enrolled in Lehigh University
- Graduated with Bachelor of Arts in business
- Occupations
- maintenance workeraircraft pilot
- Biography
-
Frederick Crist Trump Jr. /ˈkrɪst/ was an American airplane pilot and maintenance worker. The eldest son of real-estate businessman Fred Trump Sr., he fell out of his father's favor and became an airline pilot instead of taking over the family business, leading to his younger brother Donald Trump taking over the business instead. Both Fred Sr. and Donald disparaged Fred Jr. for this decision. By the early 1970s, he could no longer function as a pilot due to his alcoholism, a condition which also contributed to his fatal heart attack at the age of 42.
-
Alina Habba

- Occupations
- lawyer
- Biography
-
Alina Saad Habba is an American lawyer and political advisor who was named acting United States attorney for the District of New Jersey in July 2025, having previously served in an interim capacity from March 2025. Her July appointment was ruled unlawful in August 2025 and the ruling was upheld on appeal in December 2025. She announced she was resigning from the post on December 8, 2025. A member of the Republican Party, she previously served as a counselor to the president from January to March 2025.
-
Stephanie Ruhle

- Enrolled in Lehigh University
- 1993-1997 graduated with Bachelor of Arts in international business
- Occupations
- journalistnews presenter
- Biography
-
Stephanie Ruhle Hubbard is an American television host who is the host of MS NOW's The 11th Hour with Stephanie Ruhle. Previously, Ruhle was managing editor and news anchor for Bloomberg Television and editor-at-large for Bloomberg News, and later the NBC News Senior Business analyst. Ruhle co-hosted the Bloomberg Television show Bloomberg GO and was one of three Bloomberg reporters who broke the story identifying the trader behind the 2012 JPMorgan Chase trading loss.


General info
| Alternative names | LU |
|---|---|
| Founded | 1865 |
| Motto | Homo minister et interpres naturae Man, the servant and interpreter of nature |
| Colors | brown, white |
| Academic calendar | August to May |
| Total FTE staff | 1,987 |
| Carnegie classification | Doctoral Universities: High Research Activity |
Location and contacts
| Address | 27 Memorial Drive West Bethlehem, Pennsylvania, 18015 United States |
|---|---|
| City population | 76,000 |
| Phone | 6107583000 |